Your product’s metrics are crashing.
Revenue is down 5% week-over-week, and daily active users are down 4%. You know Team A shipped a new product ranking algorithm, Team B optimized the payments flow, while the marketing team overhauled their retention campaign. Meanwhile your analysts remind you that it’s the start of summer and to expect “some” seasonality.
How will you determine what’s TRULY driving the crash? Will you rely on gut-feel and tenuous correlations? Or does your company have a culture of experimentation and habitually run A/B tests to measure and understand cause-and-effect across your product?
What is A/B Testing?
Also known as split or bucket testing, A/B testing is the scientific gold standard for understanding and measuring causality (ie. which changes cause which effects). It’s an objective scientific method that ignores biases and opinions, while minimizing spurious correlations. This process is best known in clinical trials to measure the benefits and safety of experimental drugs (eg. COVID-19 vaccines) and has become standard practice in digital marketing. Lately, it’s been gaining popularity in product development where tech leaders like Facebook, Netflix, AirBnB, Spotify, and Amazon are running thousands of tests to rapidly optimize their products for their users.
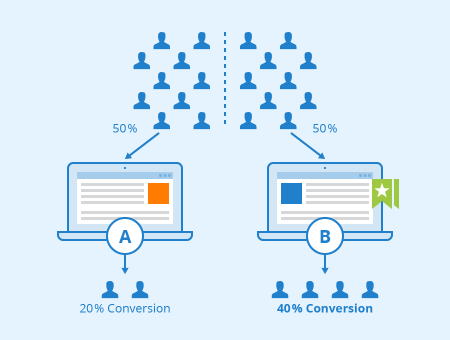
The simplest A/B test is an experiment with one product change, eg. a new feature. Users are randomly split into two groups, labelled A and B, or test and control. The test group receives the new feature, while the control group receives the base version without the feature. By calculating differences in user engagement metrics (eg. time-spent, retention, and number of purchases) between the test and control groups, and applying a statistical test to remove noise, one can measure the impact of the change and determine whether this is a positive, neutral or negative change.
Importance of Randomization
The secret power of A/B testing is in the randomization process. Users are randomly sorted into test and control groups. This is an unbiased process that with enough users, controls for all possible confounding factors, both known (eg. age, gender and OS) and unknown (eg. personality, hair color and sophistication), making comparisons between test and control groups balanced and fair. Since both groups are exposed and measured simultaneously, A/B testing also corrects for temporal and seasonal effects. Statistically significant differences between the test and control groups can be directly attributed to the change being tested.
Statistical Testing — Achieving “Statsig”

When comparing the test and control groups, one needs to apply a statistical test. This identifies whether the differences are statistically significant, or plausibly due to random chance. Flipping a coin that results in 6 heads out of 10 flips (60%) is conceivably due to random chance. One may become more skeptical if you find 60 heads out of 100 flips, and one should be bullish that 600 heads out of 1000 flips is positively due to a biased coin. This process of qualifying results through understanding probability is called statistical testing and is necessary for properly interpreting your experiment while steering clear from deceiving results.
Since even extreme results can arise from random chance (600 heads out of 1000 flips has a 0.000002% of occurring), we need to set an objective bar for what we consider as unlikely. This is called a significance threshold. It’s typically set at 95% which means that if the probability of achieving a result (or anything as extreme) is >5%, we will attribute it to random chance. Conversely any results with a probability less than this threshold are called statistically significant, or as we say, “statsig”. Achieving “statsig” is generally affected by the size of the effect, the variance of the data, and the number of observations in an experiment.
A/B Testing Provides a Complete View
The greatest feature of A/B testing is being able to measure effects over a wide range of metrics. This allows the experimentalist to evaluate primary, secondary and ecosystem effects to provide a holistic view of the feature’s total impact. Increasing the image size of a product preview might increase product views (primary effect) and drive an increase in purchases (secondary effect). However one might also observe a drop in items per cart, an increase in return rates, while harming retention (ecosystem effects). These may even combine for an overall reduction in revenues. Having the complete picture is necessary for making the right decision.
A/B Testing Should Be Easy

Interested in trying out A/B testing to improve your product? Statsig makes A/B testing easy and accessible to everyone. To try for free and get your first test underway, visit us at statsig.com.


