The best product teams are always on the search for ways to fine-tune their applications, seeking even the slightest improvements.
This has led to a proliferation of digital analytics platforms for software companies to monitor their performance. These platforms have evolved to include a bevy of features to track and assess performance, including conversion rates, retention tracking, and overall customer experience journeys.
Amplitude was an early entrant, but the company now faces competition from a number of other analytics vendors, each with its unique set of advantages and potential drawbacks.
Let's dive into Amplitude, and then explore potential alternatives in detail.
What is Amplitude?
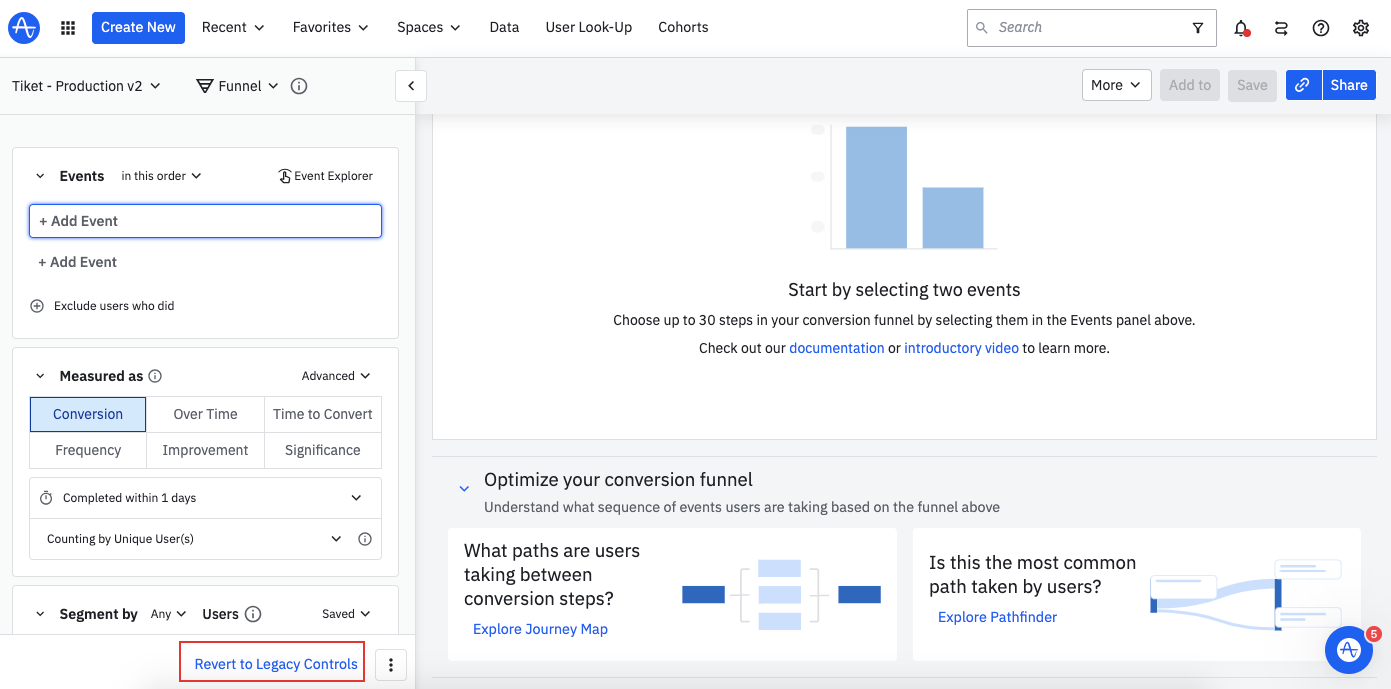
Amplitude is an analytics tool for growth and product teams, providing insights into user behavior and customer journeys to inform digital business strategies.
Co-founders Spenser Skates and Curtis Liu launched the company in 2012 after discovering a gap in the market—no existing tools, at the time, were available to help make sense of how users interacted with their app.
After emerging from stealth mode in 2014, the San Francisco-based company matured into one of the largest players in the digital analytics space with more than 2,400 customers.
Amplitude has been steadily broadening its suite of products in a bid to catch up with industry competitors. In 2021, the company announced Amplitude Experiment, a suite of tools that integrates A/B testing with its customer behavior and product analytics features. This was followed in 2023 when Amplitude announced its first warehouse-native solution.

Pricing model: Amplitude offers its products in separate segments, including Analytics, Audiences, Experiments, and CDP, with incremental pricing for each. Features such as advanced permissions and real-time monitoring are exclusive to the top-tier package.
Starter tier: A free Amplitude Analytics package with limited functions
Growth tier: $995 per month
Enterprise: Contact sales
Notable features:
Warehouse-native solution
Customer journey mapping
Campaign management
Behavioral targeting
Watch out for: Users have reported that Amplitude can sometimes be difficult to navigate and even “overwhelming,” especially for new users. This complexity can potentially confuse non-analysts due to its packed features.
One user noted that it can be difficult to move data in and out of Amplitude, which can be a significant inconvenience for users who need to manage large datasets or require flexibility in data operations.
Statsig versus Amplitude, head to head

The top Amplitude alternatives
1. Statsig

Pricing model: Statsig offers unlimited seats, free feature flags, and .
Pro tier: Starting at $150/month
Enterprise and Warehouse-Native: Contact sales
Notable features:
Advanced stats engine (CUPED and sequential testing with Bayesian or Frequentist approaches)
Highly rated in-house support team
Out-of-the-box metric attributes
Holdouts, Experiment Layers, Dynamic Configs, and more
Warehouse-native or cloud-based implementation
Advanced experimentation features like switchback testing, automatic rollout metrics, snapshot metrics view, and more
Summary: Founded by ex-Meta engineer Vijaye Raji, Statsig provides a flexible platform that offers cloud-based and warehouse-native solutions for product experimentation, feature flagging, and analysis.
The tool has received hundreds of positive reviews and has become popular among developers and product teams. Although it initially targeted smaller companies, it has now expanded to include major tech players such as Microsoft, Notion, and Figma, who are among its users.
Watch out for: One user notes the learning curve associated with Statsig, stating: “[Y]ou need to invest time to learn the system to unlock the most value from the platform.” The user commends the support team and documentation for being helpful but expresses a wish for “future iterations of the platform to include turn-key templates for more complicated setups such as multi-site/tenant.”
✅ Feature comparison: Statsig versus Amplitude, head-to-head.
2. Adobe Analytics

Pricing model: Adobe offers a scalable pricing model that adjusts to the size and scope of a business’s analytics needs.
Starter tier: Pricing starts around $2,500 per month for smaller companies, ballooning to upwards of $100,000 monthly for enterprise solutions.
Notable features:
Real-time reporting
Clean and simple user dashboard UI
Collaboration and sharing
Tracking and KPI performance analysis
Summary: Adobe Analytics, part of Adobe’s Experience Cloud, was launched as Omniture in 1996 and later acquired by Adobe in 2009. It tracks web and app usage, offering features like advanced segmentation, real-time data, and predictive analytics. It helps businesses analyze customer behavior, optimize marketing campaigns, and enhance user experiences.
Watch out for: Some users have raised concerns over Adobe’s slow server speeds, resulting in users encountering performance and data reporting latency. While data is typically returned to users within 15-to-20 minutes, the servers can sometimes be “slow to collect and show all the data for several hours.”
Another reviewer gripes about the difficult setup process: “In my experience, set up of a new website in Adobe Analytics from scratch is absolutely atrocious. It is not ready to roll out of the box, unlike other web analytics software.”
3. Mixpanel

Starter tier: Mixpanel offers a free tier for up to 20 million events per month.
Pricing model: The growth plan includes more advanced features like no-code data transformations and data pipeline add-ons, with a price of $25 a month. The enterprise version includes its full suite of services and premium support, with a price of $833 per month.
Notable features:
SQL queries and data pipelines
Behavioral segmentation
Customizable dashboards
Automatic funnel segment analysis
Summary: Mixpanel is a user analytics tool that tracks user interactions on websites and apps. Launched in 2009, the tool offers event tracking, funnel analysis, and retention tracking, helping businesses understand customer behavior and improve their products.
Watch out for: Some commenters warn that customer support has waned over time, forcing some users to troubleshoot issues on their own. A customer points out that Mixpanel does not provide a phone number for support, instead requiring customers to reach out via email. Online commenters also say the platform is relatively expensive after reaching user limits.
4. Google Analytics (GA4)

Starter tier: Google Analytics free version allows users to track up to 10 million hits a month.
Pricing model: Google Analytics 360 caters to larger enterprises with high traffic, offering a subscription model that varies on each customer’s specific needs.
Notable features:
Goal setting and tracking
Advanced e-commerce analytics
Personalized dashboards
Machine learning for predictive analytics
Summary: Google Analytics is a web and app analytics tool, part of the search engine’s marketing suite. Launched in 2005, the tool tracks and analyzes web traffic and user events, helping product teams assess online campaigns, landing page quality, and conversions. Google Analytics evolved to include machine learning for predictive analytics and enhanced e-commerce tracking, among other new features.
Watch out for: Online commenters warn that Google Analytics can often be time-consuming and otherwise difficult to use. As one user writes: “Google Analytics is not user friendly. It’s difficult to navigate and it’s difficult to make sense of it. I have wasted a lot of time setting up an account and setting up my information, only to have one IT issue after another, rendering it almost useless.”
There may also be concerns over its compliance with General Data Protection Regulation, or so-called GDPR, regulations. A Swedish Watchdog group discovered that “supplementary measures applied by Google to European users’ data sent to the U.S. for processing were insufficient to raise the level of protection to the required legal standard.”
Additional reading: Use Statsig for analytics
Get started now!

