Statsig Analytics is a game-changer. Here's how to add it to your Next.js application.
By implementing Statsig Analytics into an application, users can enjoy:
Real-time data: Tracking user behaviors, interactions, and performance metrics in real-time, providing actionable insights.
Custom event logging: Users can log custom events to analyze specific user interactions and optimize engagement and conversion.
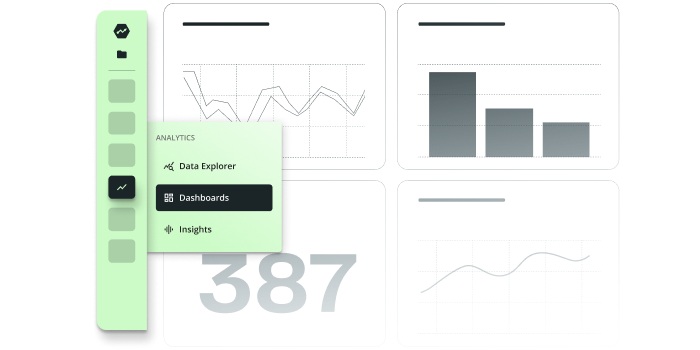
Comprehensive dashboarding: Statsig provides a user-friendly dashboard that allows for real-time monitoring and analysis of key performance metrics, user segmentation, and A/B testing.
How to get started:
1. Install the Statsig SDK
Integrating Statsig into your Next.js project is straightforward and begins with adding the SDK to your project using npm or Yarn.
To get started, first open the terminal and navigate to your project directory, then run one of the following commands depending on whether you’re using npm or Yarn:
or
This command installs the Statsig JavaScript SDK.
2. Initialize the SDK
Next, you’ll need to initialize the SDK within your Next.js app. You can do this by importing Statsig at the top of your pages/_app.js, which is the core file that loads with your application:
Place the initialization code inside the pages/_app.js file. Use your unique client SDK key, which you can obtain from your Statsig dashboard:
Initializing the SDK in this manner ensures that user activity is tracked throughout the user’s journey in your application, enabling detailed analytics and segmentation.
3. Log custom events
With Statsig integrated and initialized, you can start logging custom events to track specific interactions within your app. Custom events provide deep insights into how users interact with your app and what drives engagement and conversion.
Use the logEvent method to capture user action:
Logging such events allows you to gather data about how users interact with specific elements in your site or app, which is invaluable for optimizing user flows and improving overall user experience.
4. Use the Statsig dashboard

The Statsig dashboard will allow you to:
Monitor and analyze user behavior, engagement metrics, and conversion rates in real time.
Customize your analytics views to focus on the metrics that matter most to your business.
Segment users based on behavior, demographics, or custom properties to better understand different user groups.
Set up A/B tests and feature flags directly from the dashboard to experiment with new features or changes without needing to deploy new code.
Any questions?
If you have any questions on how to accomplish this—or anything else within Statsig—please don’t hesitate to reach out!
Related reading:
Get started now!


