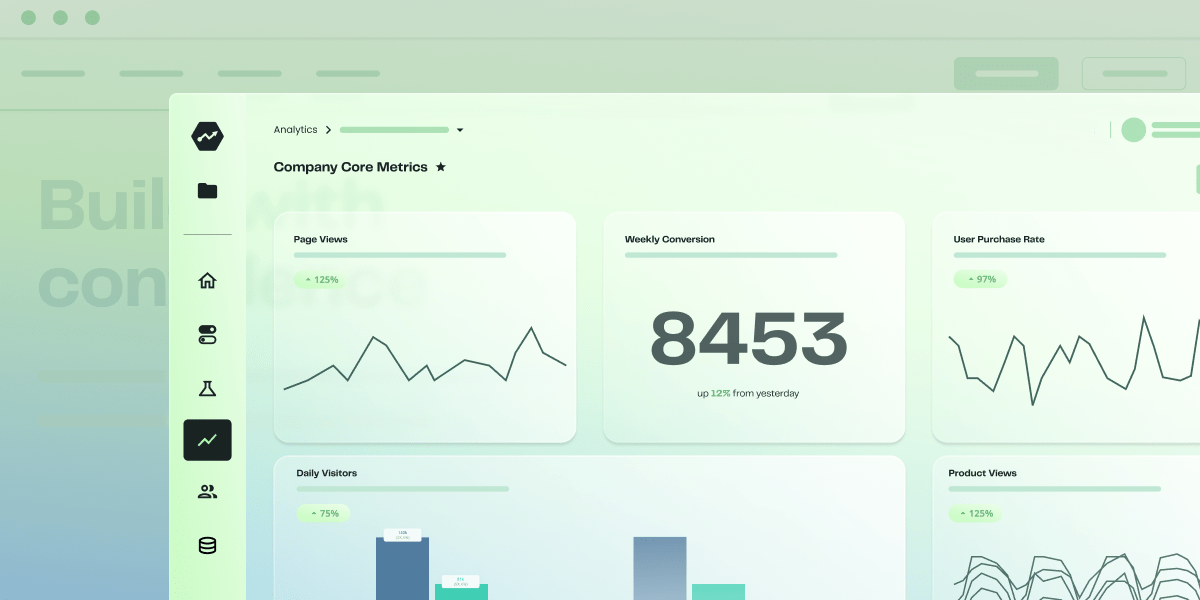
Web Analytics lets you track key website metrics effortlessly: an ideal launchpad for startups looking to become more data-driven!
Today, we are excited to introduce Statsig Web Analytics with Autocapture, designed to give you out-of-the-box insights into website performance, so you can start iterating from Day One!
Your website is often the first point of interaction for a user discovering your product. Say you've just launched your startup and are actively promoting it across various channels—from LinkedIn to Hacker News, engaging in Reddit threads, and possibly even investing in Google ads. But what happens once users land on your website? How do you ensure they stay, engage, and ultimately convert?
Why we built Web Analytics and Autocapture
At Statsig, we want startups to be empowered with data from the get-go, and grow with our platform—from acquiring your first paid user to reaching hundreds of millions of MAUs!
We launched Product Analytics earlier this year to bring data into every stage of product development, but soon realized there is a key step in the user journey before they even sign up for a trial.
Our Web Analytics product is designed to fill this gap, giving you instant, actionable insights into core website metrics. The motivation to build Web Analytics was threefold:
Offer a low-friction approach to becoming data-driven from Day One
Develop more tools tailored for startups at the earliest stages of acquiring new users through a marketing site
Make it easier for marketers, web developers, and less-technical stakeholders to use data in their day-to-day
What can you do today with Statsig's Web Analytics?
Simply add our JavaScript snippet to your website, and you can start auto-capturing events and tracking key website metrics instantly:
Track the number of visitors, page views, errors, clicks, session duration, scroll depth, form submissions, and more, right out of the box. Instantly identify low-hanging fruit and secure your first growth wins with data!
Create custom metrics from these auto-captured events, then curate and share dashboards by applying custom filters and aggregations to create the most useful views for your team
Website performance is a great first dashboard for any startup (the first of many you'll build with Statsig as you scale) that can drive immediate product optimizations and kickstart your growth flywheel.

Going from measurement to optimization
Measurement is just one step in the build → measure → learn feedback loop. We recently launched two other tools that play nicely with Web Analytics and allow you to iterate rapidly:
Session Replay: Watch how users navigate your site and pinpoint exactly where engagement drops off, so you can address issues without any guesswork!
Statsig Sidecar for low-code website experiments: Concerned about low click-through rates or high bounce rates on your Web Analytics dashboard? Statsig Sidecar allows you to easily test various website elements—like text, design, CTAs, and scripts—right from your browser, without needing technical expertise!
We are really excited about what Web Analytics can unlock for startups and would love to hear your feedback as we continue building more features!
Get started now!

