Platform
Resources


When you’re buying a product analytics platform, it’s hard to know if you’re getting good value.
Pricing for analytics is rarely transparent.
Different vendors have different definitions of events. Some vendors bill on monthly active users, some use events, and others have “flat rate” tiers with unlimited usage under a certain volume.
As we’ve designed analytics pricing, we’ve looked closely at how other players in the industry are pricing their solutions. We created a spreadsheet to compare pricing, which includes all the formulas we used + any assumptions we made. Please share feedback on our methodology!
In this post, we’ll share what we learned. Hopefully this gives you a clear sense of how to compare pricing across vendors.
Assumptions about pricing
For some platforms, it was easy to calculate price at a given level of monthly events.
Mixpanel, Posthog, and Statsig all set prices based on “analytics events” and charge a set rate per analytics event above a certain threshold.
Unfortunately, it was a bit tricky to quantify the cost of Ampltiude’s “Plus” package on a per-event basis. Amplitude recently shifted from pricing based on number of events used to pricing based on MTUs (monthly tracked users).
To convert Amplitude’s pricing into common units, we had to make a few assumptions on how many analytics events each MTU generates per month. We assumed that each MTU generated ~120 analytics events per month (this is roughly in line with the average events generated per MTU that we see with our self-service customers).
This is a big assumption, and the value can vary wildly per company.
If you run a company with a very sticky set of users and you track a ton of events, Amplitude could be significantly cheaper than what’s shown here.
Alternatively, if you’re using Amplitude on your website and tracking users who only visit once or twice without generating many events, Amplitude could be significantly more expensive than what’s shown here.
The results

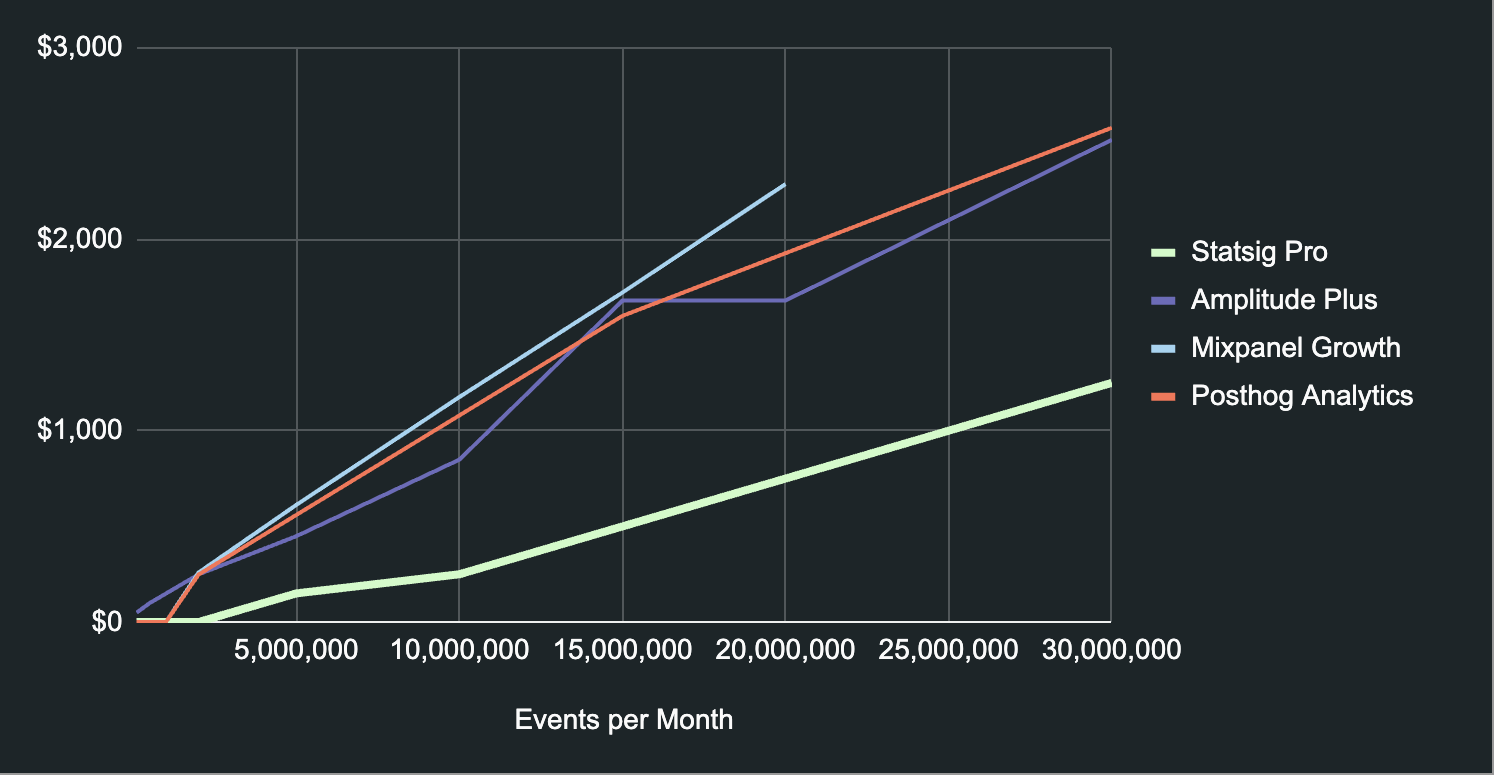
There was a surprising range of prices between the primary platforms in this space!
At the low end, almost everyone was free. Each company has a pretty generous free tier for really small companies, which goes a long way.
Around 2 million events per year, things start to get interesting.
Through most of the curve after 1M events, Mixpanel is the most expensive tool in the space. Although Posthog and Amplitude are not far off from Mixpanel's prices and are still nearly 2-3x more expensive than Statsig through most of the curve. Posthog does offer an open-source version of their tool (which is presumed free), but the hosted version is consistently more expensive than other options.
Amplitude Growth starts in the middle of the pack but spikes around 10M events / month (when our model means a customer crosses 200K MTUs).
Statsig is consistently the least expensive throughout the curve. In case you think we’re biased, please check our work!
Given the maturity of the product analytics space, it’s surprising to see so much variation in price! It’s also fascinating to see such big jumps in the pricing curves.
Other things to consider
Many of these analytics platforms come with other tools bundled in their offering (for free).
For example, Amplitude Plus comes with Feature Flags, CDP capabilities, and Session Replay. Statsig includes free, unlimited feature flags, advanced experimentation, and dynamic configs.
Other platforms offer all these features but charge extra for each one. Posthog offers many tools, but each tool represents a new paid SKU—you can’t use your analytics events to run experiments, and you have to pay more for each session replay, feature flag request, or survey that your team runs.
Another thing to consider is scalability. At these volumes, every platform is likely to have similar performance, but different platforms have a different ability to scale with your growth (both in terms of price and performance).
Closing thoughts
If you’re curious about our methodology, you can see all our work in this Google Sheet (including screenshots of pricing plans from other players).
Hopefully you found this comparison helpful! Analytics pricing can be a tricky thing to figure out. And of course, if you’d like to have a personalized chat about this, please reach out.
Introducing Product Analytics