More than Blue Button vs Green Button: How we use Statsig
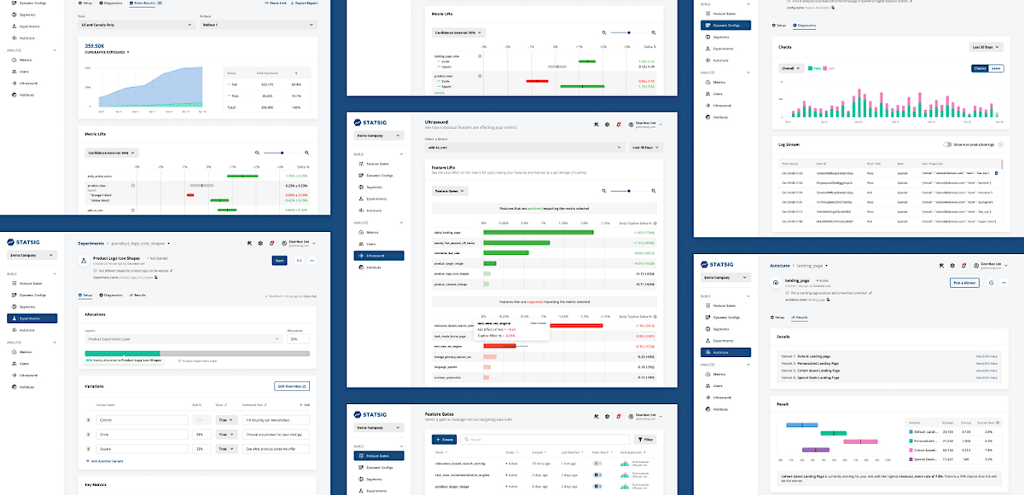
Statsig is a feature flagging and experimentation platform, and the most frequent response to this is “what do you mean by experimentation platform?” The easiest way to explain it: Statsig helps you run A/B tests to optimize your product.
When people hear this, they often jump to “Oh, so green button vs blue button, right?” And that is a part of it — you can use Statsig to run tests on different UI treatments to optimize your product funnel or usage on the client side.
But A/B (or A/B/n) testing is not inherently UI related. In fact, it is incredibly useful for optimizing performance on the backend. At Facebook, it was simple to set up a test and measure the impact on gCPU (global CPU usage) to estimate the cost associated with fully rolling out a change. Some engineers got very good at identifying performance bottlenecks, running experiments to estimate the impact of fixing them, and then rolling out the changes, saving the company millions of dollars in the process.
Statsig can be used for these types of analyses as well, not just to help you choose between button colors. Here are just a few more examples of ways we have used Statsig ourselves, and the specific Statsig tools we used to accomplish them.
Experimenting with compression algorithms to reduce memory usage
api.statsig.com is processing millions of events for many different companies. This is more than enough traffic to experiment with a partial rollout of features like different compression algorithms. So we set up an experiment with a feature gate and a 10% rollout to experiment with compressing some of the data we cache.
Since this isn’t experimenting on end users, but instead on our backend systems, the unitID for the experiment was the was the ID of the pod. In this way, we can compare the performance of some pods using brotli-3 compression, and others using brotli-5.

The green bars may be a bit misleading — they indicate a statistically significant increase in the metric, which in this case means an increase in cpu usage. This increased cpu usage caused an increase in API latency. And the cherry on top —it also used more memory! In the end, the winner was brotli-5, which we are using today.
Tools used: node.js server SDK, custom metrics, feature gates.
Event Logging to analyze usage of pages on docs.statsig.com
If you visit docs.statsig.com, you may notice that the statsig javascript client SDK is included on each page. Our docs repository is entirely open source, so a close reading would show that we aren’t using this for feature gating or experimentation (though we may start to gate off docs that are a work in progress), but just for event logging. Using the metrics tab in Statsig, we can then get a picture of the how people are using the docs site.
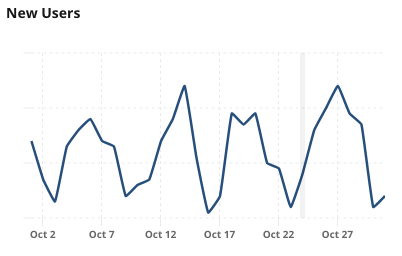
Tools used: js SDK, event logging, metrics tab.
Feature Gating on the Statsig Console
Finally, and perhaps most obviously, we use Statsig to “gate off” features which aren’t ready for primetime. For example, we recently announced the new Metrics Catalog, with support for tagging metrics collections to organize your pulse results. That’s been under development and gated off for non-employees until recently.
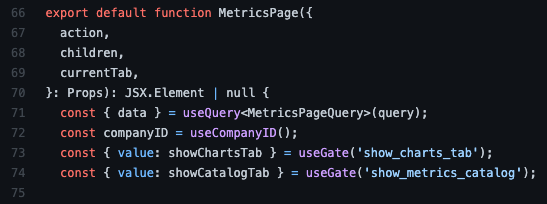
Tools used: react SDK for console front end, node.js SDK for server side, Feature Gates.
Bonus: Autotune
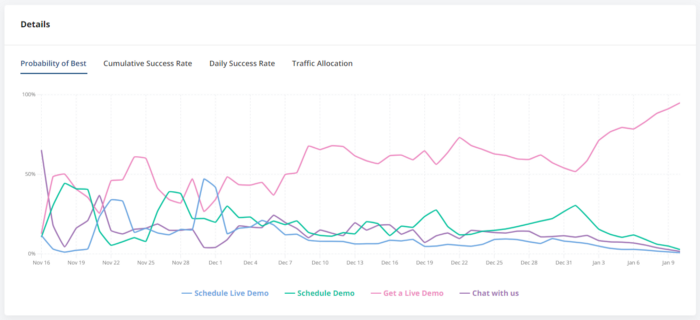
Autotune is Statsig’s multiarmed bandit (MAB) testing tool. It allows you to optimize for a single metric with an experiment that automatically directs traffic to the winning variant. Tim wrote more about it in this blog post. We ran an autotune experiment on www.statsig.com to optimize our primary CTA. See the button on www.statsig.com labeled “Get a Live Demo?” It hasn’t always said that, and we experimented (using autotune) with a few different variants: “Schedule Live Demo”/ “Schedule Demo” / “Get a Live Demo” / “Chat with us”
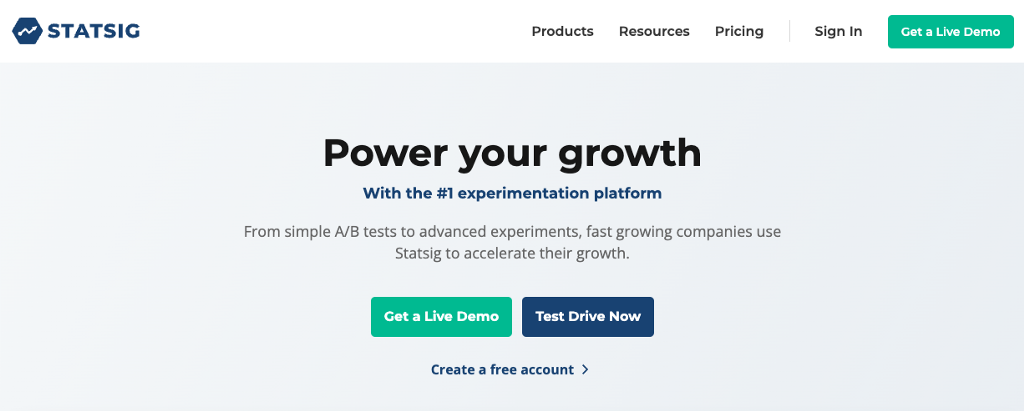
After running the autotune for a few weeks, “Get a Live Demo” won out:
Tools used: node.js SDK on the server, js SDK on the client, event logging and autotune!
What have you built using some of our tools? Feel free to drop a note in our slack channel.
