
Nearly three years ago, Statsig embarked on a mission: to empower everyone to make better products with data.
Learning this strategy from the most successful technology companies, Statsig aims to make data-driven product building available to teams of any size. Our journey has resonated with our customers, now including Notion, Flipkart, Brex, Lime, and more.
From Statsig’s inception to managing an astounding 2.3 million events per second, our journey has been made possible by the trust our customers have placed in us.
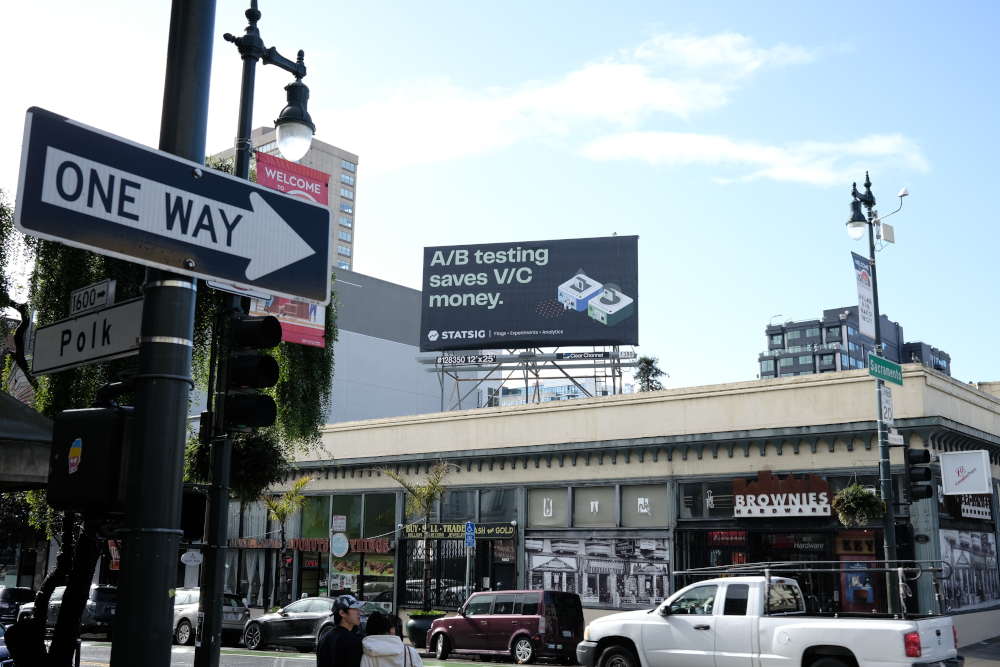
This week, we brought this vision to San Francisco and went big, with over 200 displays featuring the Statsig logo. Our goal is to introduce every San Franciscan to the tools that simplify data-driven product development at fast-growth startups and Fortune 500s alike.
Build > Measure > Learn > Repeat
Our campaign is centered around a simple mantra: Build, Measure, Learn, Repeat.
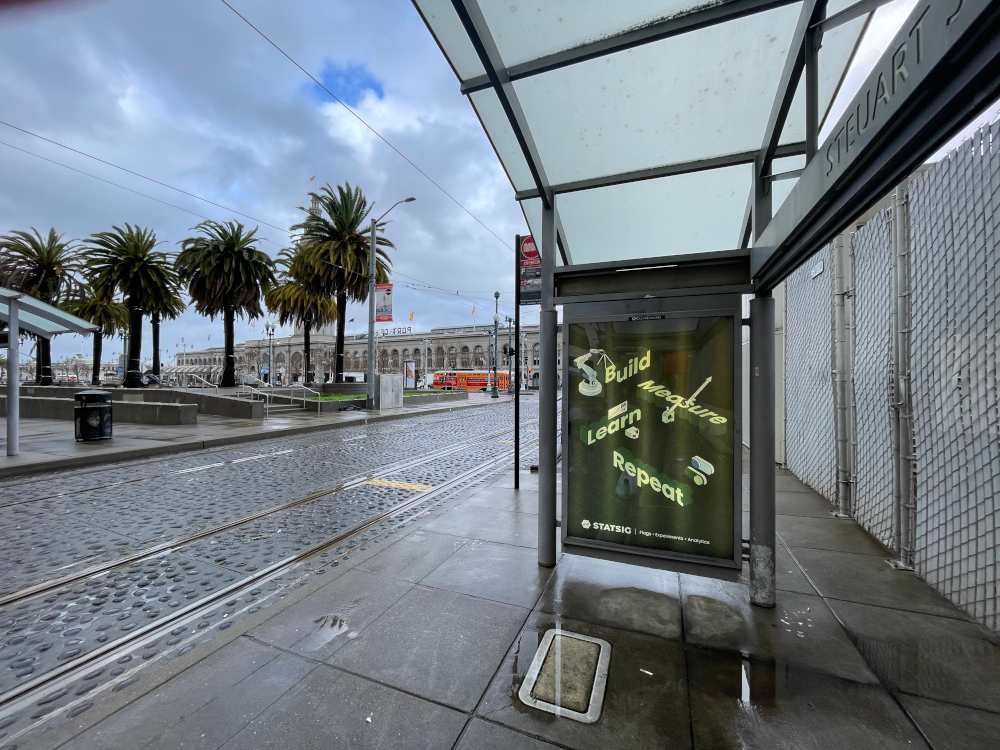
At Statsig, we champion the "experimentation culture," encouraging teams to leverage data in every step of product development.
The messages we chose aim to communicate why this process is so valuable: The ability to know which features are helping, and which aren’t (”Ship your winners, kill your losers”), to reject gut feeling in favor of data (”Don’t think, test), and save money along the way ("Ship good features, Cut bad spend").
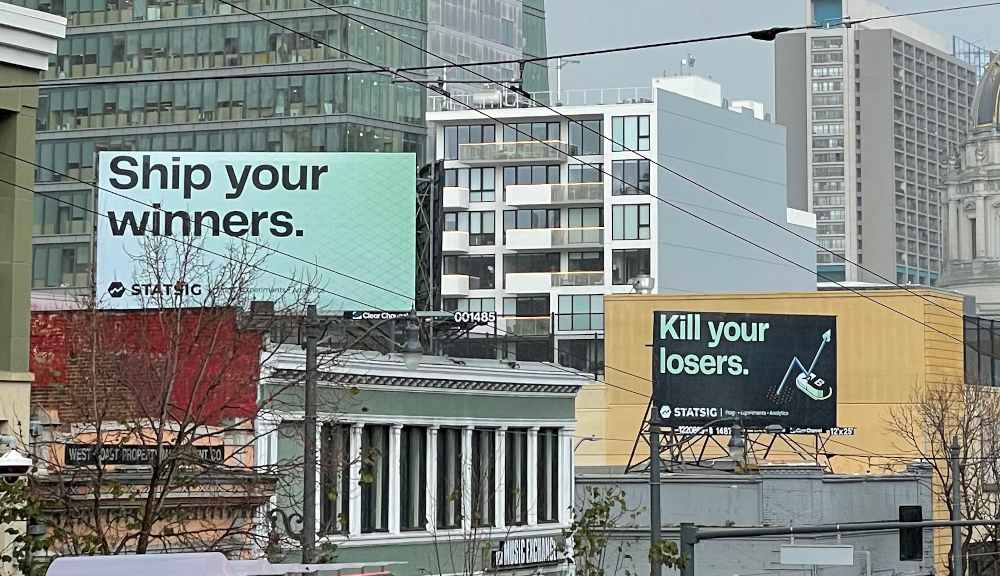
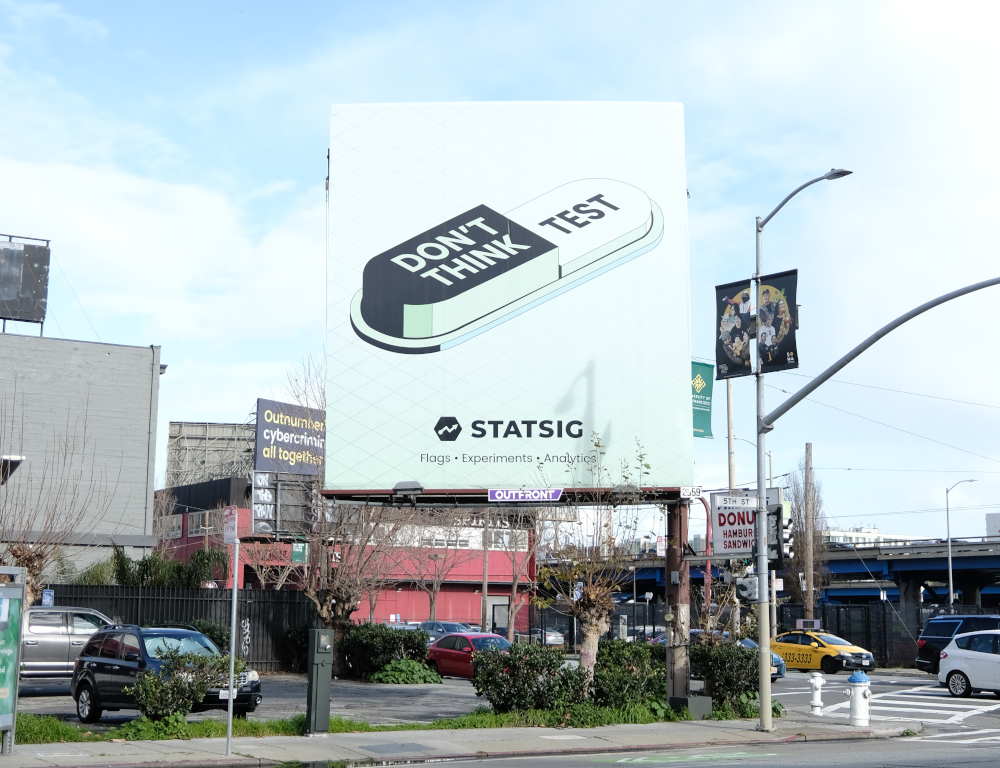
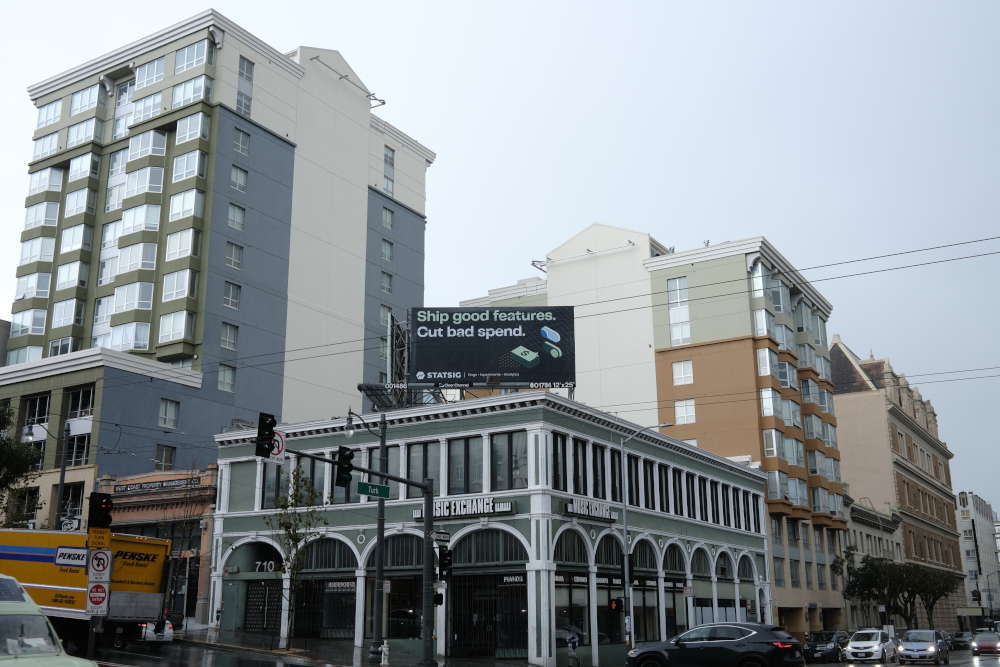
We’re a data-driven company, so running a campaign in a channel that's so hard to measure isn’t in our nature. But out-of-home advertising presented a unique opportunity to connect directly with prospective users in San Francisco, outside of our Seattle base.
The medium also provided a chance to engage with the community in a meaningful, yet creative and fun way. This didn’t go unnoticed, with Geekwire and others taking notice!
Read our customer stories

Why people love Statsig
Customers love our product—a platform for the whole team, including flags, experiments, and analytics, that scales from the needs of a hobby developer to an expert data scientist.
Statsig also doesn’t charge for seats. We encourage every team member to use our platform to understand their product, no matter the team size. Our vision is to provide the best data tooling for everyone, so we work with customers of any size.
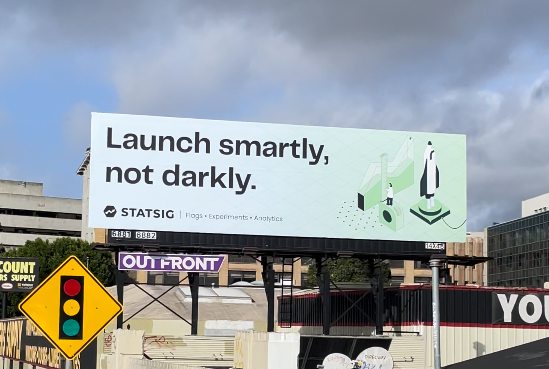
But customers often love working with Statsig for reasons deeper than that: we work hand-in-hand with our customers to develop an experimentation culture, have famously strong customer service, and ship incredibly fast. In other words, we make it easy to Launch Smartly, Not Darkly:
To experience the Statsig difference, we invite you to book a call, sign up for an account, or explore our demo.
Special thanks to the campaign team
This campaign wouldn't have been possible without the support of Brex and the Brex Billboard Program or the team from the Division of Labor, a San Francisco-based creative agency.
Join the Slack community

