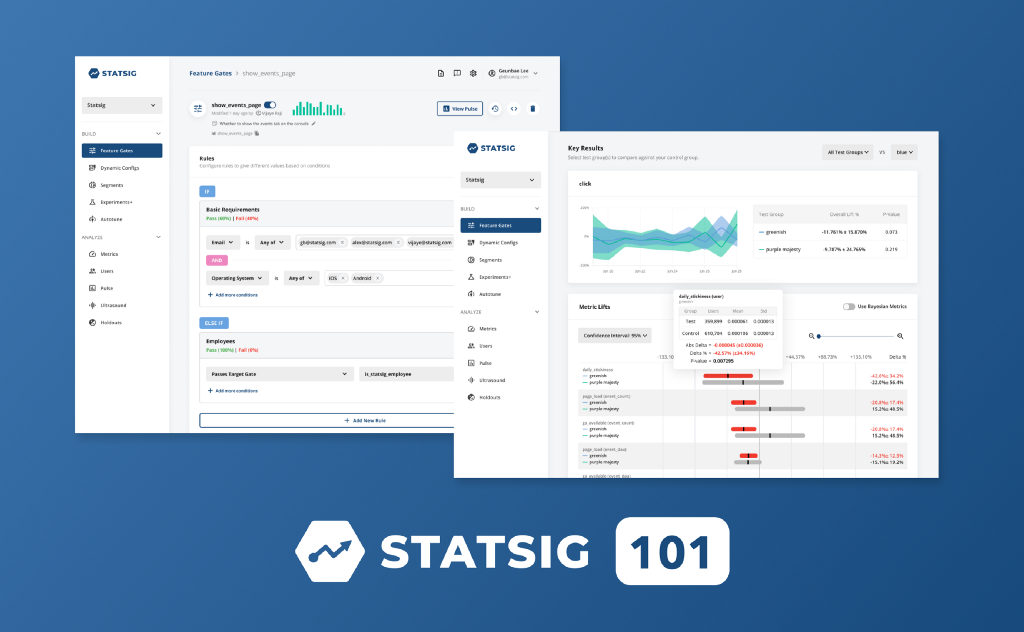
Use Statsig just like the people who built it
We’ve been using Statsig for the past four months across different surfaces: www.statsig.com, our main landing page, console.statsig.com, our main web interface for using Statsig as a tool, and in some internal tools we’ve built for ourselves.
Coming from Facebook, it was natural for us to use Feature Gates to “gate off” features under development, Dynamic Configs to decouple configurations from front-end code, and Experiments+ to start optimizing our conversion funnel. We use all of these and more every day.
But where did we get started? How can you dip your toes in without knowing what you might use Statsig for?
Step 0. Create a Feature Gate
Whenever you are building a new feature, the first step should be to create a Feature Gate. This will enable you to put a conditional check in your code to check if you should show the new feature.
Gates are always “off” (return false) by default. So you can create a Feature Gate without adding any conditions to it, and it will always return false. Rain or shine, no matter which SDK or what network conditions, that Feature Gate will return false.
Here, I’ve created a gate for the new search ranking model I am working on.

Step 1. Add a Conditional Branch
With the default value = false in mind, add a conditional branch to your code checking the gate. This gate is still going to always return false, so you can put whatever you want inside the “true” block — you could start with a simple print statement if you haven’t built anything new yet.
At this point you can even check in the code, and control the conditional branch just by updating the conditions and rules on the gate in the Statsig console.
Step 2. Open the Feature Gate to “only me”
Now that you are confident the new code is always gated off, how can you test the experience with it turned on? Update your Feature Gate to only pass with a specific ID or custom field, which you set in your StatsigUser object to test. As you integrate with any of our SDKs, you can pass this field the same way.


Once you have created an “only me” rule, save the changes and you can quickly test via the inline “Test Gate” console, or using the conditional you already created.


Now you can start to build, integrate an SDK, and merge your code with the confidence that your in-progress features will only be visible to you.
Step 3. Expand access to your teammates or entire company
Once your feature is ready for more eyes, update the Feature Gate’s targeting conditions to turn it into a “dogfooding” gate. Rather than just opening the feature you are working on to yourself, you can open it up to your whole team, organization, or company. For example, you can use a user’s authenticated email domain to check if they have access (we do this for internal Statsig features all the time!):

You could use a list of user IDs instead of emails, a custom field, or any other combination in order to get more visibility. The key difference being it is not just you seeing the feature any more!
Step 4. Open your gate to the everyone
You can roll out your feature to anybody using an “everyone” condition, or any set of custom checks you can think of (based on app version, country, browser, device, etc). Partial rollouts will track metric variations in pulse — so rather than opening a gate to “everyone — 100%”, we suggest you open to 5%, 10%, 50%, or something in between.
Here’s an example with two different partial rollouts — a 10% rollout to the US and Canada, and a 10% rollout for everyone else.

Step 5. Check Pulse
Pulse calculates the statistical significance of changes in metric values between test and control groups, and is updated on a daily basis. Now that you have a test running, you can measure the impact of your new feature on critical metrics like app crashes, DAU, revenue, time spent, etc.
You can see an example of what this looks like in our demo company. In this case, we are analyzing only the difference between test and control for users in the US and Canada.

Step 6. Repeat
Continue to follow that same playbook:
Create a new Feature Gate for every feature you start building.
Gradually update the rules and conditions governing access to expand the audience from yourself to your team and eventually to everyone.
Use partial rollouts to get a Pulse view of the difference on your key metrics between test and control.
Tip #1: Invite others to your Statsig Project
It’s also worth inviting other Engineers, Designers, PMs, Managers, Directors, or anyone else in your team/org/company to follow along by joining the project on Statsig. There are no per-seat fees, so invite as many people to join this process as you want!
Tip #2: Use good names and descriptions!
As you continue to use this development process more and more, you will find it very useful to name your Feature Gates and give them good descriptions. Using a descriptive gate name will help your code read better and make it more clear in the Statsig console what a particular gate controls. If access to each feature is controlled by its own Feature Gate, you can decide independently which gates to open only to yourself or your team, and ultimately the public. Here is an example from our Feature Gate list:

If you want a hand walking through these steps, or have questions about advanced targeting, setting up custom metrics in pulse, etc. feel free to join our slack community to discuss with us and other Statsig users.
