Platform
Resources

The first self-service way to calculate experiment results in minutes.
Today, we’re excited to introduce Statsig Lite, a free experiment calculator powered by Statsig’s stats engine, accessible directly from your browser.
Statsig has helped leading product companies like OpenAI, Atlassian, Notion, and Figma scale their experimentation cultures and run hundreds of tests concurrently. We deliver the best experiment results of any commercially available experimentation platform. Our built-in variance reduction techniques and wide range of out-of-the-box statistical methodologies ensure reliable results.
In the past, to see this in action with your data, you would have needed to implement Statsig or run a POC. Now, with Statsig Lite, anyone can simply upload their assignment (exposure) and metrics data, and visualize trustworthy experiment results in minutes!
Try Statsig Lite!

Compare experiment results with an existing tool
One of the main reasons that people switch to a modern experimentation product is to access an advanced stats engine. But without trying it out, it can be hard to know what you’re missing. Statsig Lite solves this problem.
Whether you’ve been using an in-house tool or a legacy experimentation product (LaunchDarkly, Split, Optimizely, Amplitude), you now have a fast and reliable way to compare your results to a modern platform.
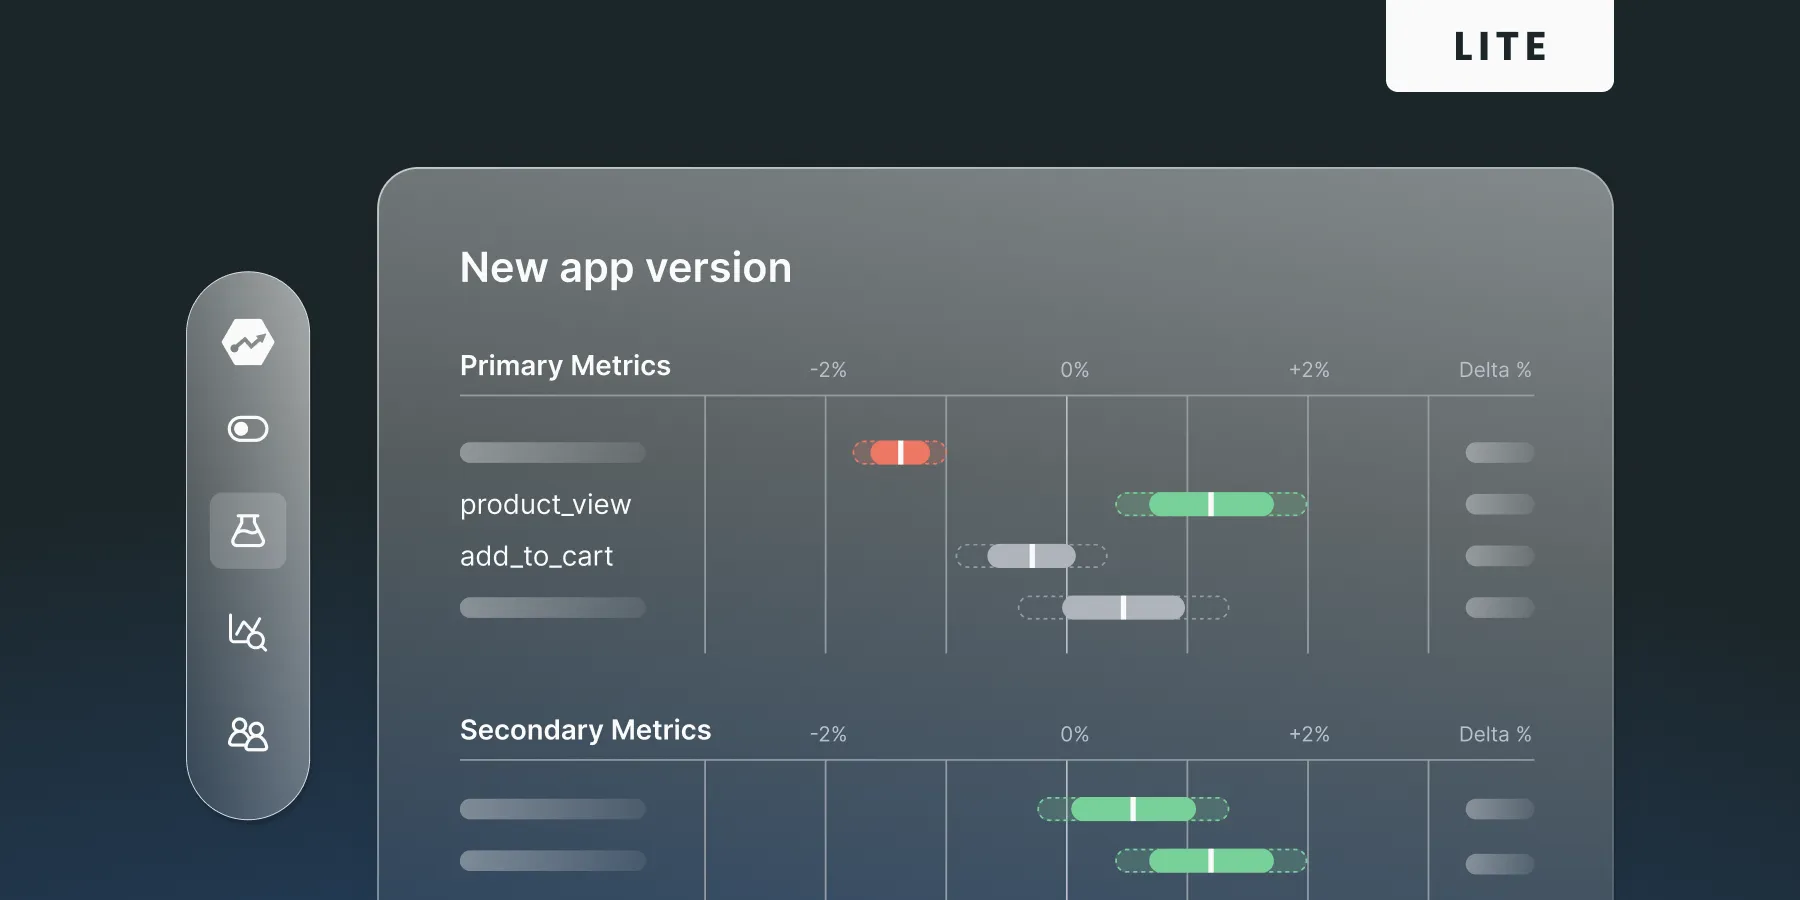
All we need are your assignment and metric .csv files, and we’ll generate a complete set of experiment results that you can explore in the Statsig console. You'll get a comprehensive view of all metric impacts, along with confidence intervals and p-values, plus the ability to dive deeper into the statistical details. You can then break down metrics by dimensions and uncover more insights.
A real-life preview of a best-in-class stats engine—no sign up required!
When you upload your experiment data, Statsig Lite will apply several statistical methodologies when calculating experiment results. These include:
Winsorization (reducing noise from outliers)
Bonferroni correction (reducing false positives)
Sequential testing
Note that Statsig Lite is just a subset of the full capabilities available in Statsig, which includes automated health checks (balanced exposures, pre-experimental bias, outlier detection etc.), advanced out-of-the-box statistical methodologies such as stratified sampling and differential impact detection, and the ability to dive deeper into results with custom queries.
If you’re just curious and want to play around, we have sample data and templates available. We’ve also got a couple of ChatGPT prompts handy to help you generate datasets:
Whether you’re interested in cutting-edge experimentation or in the market for a modern experimentation tool, there’s never been an easier way to see what you’re missing!
This idea was developed during our hackathon last month by Nick, Devin, and Vineeth as a way to get Statsig in front of more experimenters, and now it's live!
Happy experimenting :)