Rules, Conditions, and You!
Note: this posts assumes some prior knowledge of feature flags and how they can help with modern software development. If you’re already sold, and just want to learn a bit more about how they work, read on! At Statsig, we call them “Feature Gates” — they act as a gatekeeper to new features. I’ll refer to them as such for the remainder of this post.
Overview
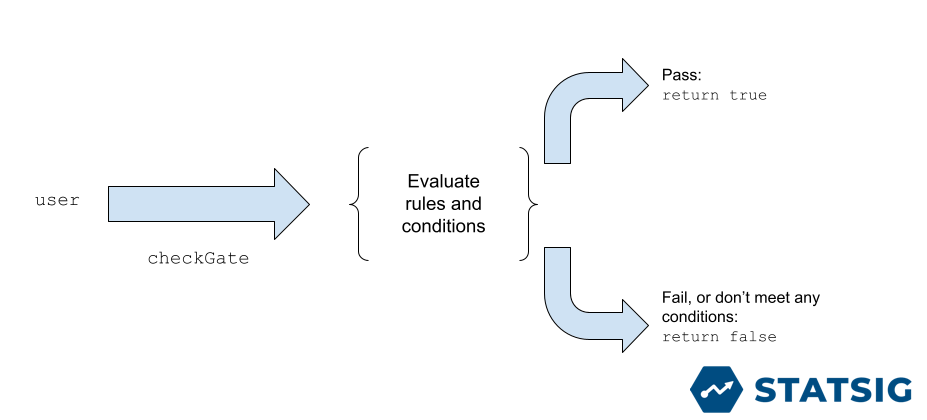
At a high level, feature gate evaluation goes like this: a developer wants to know if a user is eligible for a certain feature, so they check that user against the Feature Gate they created. This evaluates a predefined set of rules and conditions, ultimately passing if those are met, or failing if not.
But how do you define the evaluation? Let’s first look at how you define your Feature Gates in the Statsig UI, and then how that makes its way into our data model.
Feature Gates in the UI
For a real world example: at Statsig, we are continuously building new features and updating our website. For features that are still under development and not ready for primetime, we put them behind a Feature Gate. This feature gate determines eligibility for this pre-release features by checking the logged in user’s email, only allowing the feature to be shown if the email belongs to one of Statsig employees.

Let’s break this down:
There is a Feature Gate named is_statsig_employee, which has a single rule. The rule should be evaluated as follows: if the condition (as defined by: targetValue “email” matches the contains operator with input “@statsig.com”) passes, then the rule (and hence the gate) will pass 100% of the time and return true. Otherwise, the evaluation fails, and the check returns false (gates are always closed by default).
Can you specify a percentage less that 100? Sure! This is how we enable developers to slowly roll out features and validate them before launching more broadly. It’s also what enables teams to run A/B tests to understand how a certain feature impacts their critical metrics. That percentage is also stable, meaning once a user passes, that same user will always pass at that percentage rollout.
Back to our feature gate. You may be wondering, what makes up a rule or a condition? Let’s peek inside how Statsig defines and evaluates Feature Gates.
Feature Gate Data Model
Feature Gates are made up of one or more rules. Rules specify the percentage of users who pass them if they meet the conditions. So what are conditions then? They are ‘expressions’ that get evaluated every time a feature gate is checked. This is the meat of a feature gate. There are many different types of conditions, which can be evaluated with different operators and values.
As an example, a type could be the “Browser” condition, which passes for any person using “Chrome” or “Firefox”. This would be represented with a condition like this:

Bubbling back up the dependency tree, that condition would be evaluated on a rule, which in turn could be one of many stored on the gate itself. In code, the whole thing looks something like this:

Putting it all together
Going back to our “employee only” example, let’s define that gate in terms of this data model. With only a single rule, and a single condition, it’s actually pretty straightforward. It looks something like this:

And there you have it. That’s a peek into how we represent and evaluate Feature Gates behind the scenes. Any developer or team can take advantage of Feature Gates to supercharge their development workflow: whether it be to decouple your development cycle from your release cycle, or to power A/B tests to verify your features are working before fully launching.
Statsig helps power all of that and more, plus it’s free to get started. Or, if you want to experience it for yourself, take our demo account for a spin to see what it looks like!
Happy Feature Gating!
