Using Feature Flags/Gates in your app is simple and straightforward. This article will show you a step-by-step process of creating a simple Node.js app that responds to feature gate changes in almost-real-time.
This article assumes you have npm installed on your dev environment. More detailed documentation is available here.
If you don’t already have an account, create one for free at https://www.statsig.com/ and create a new Feature Gate named “First App Test”
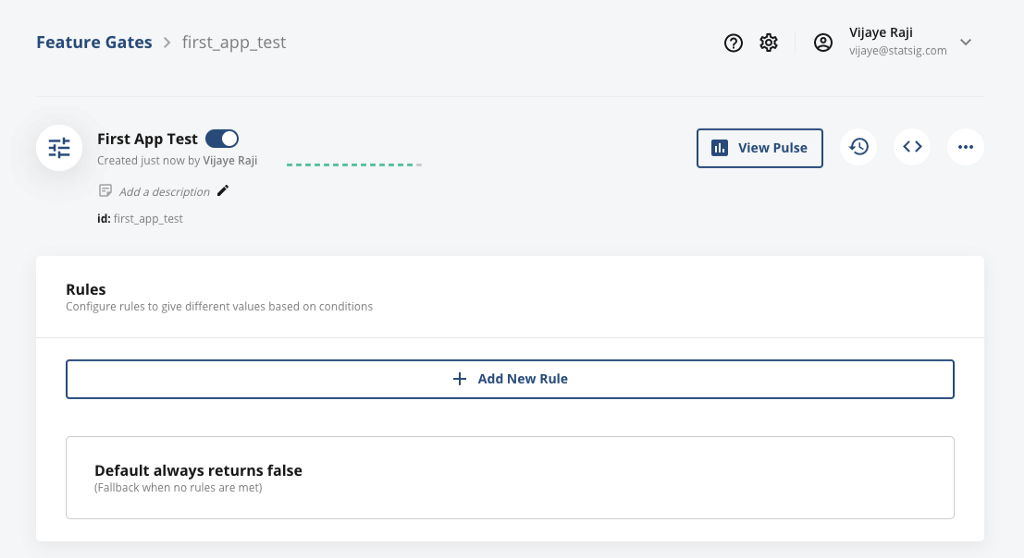
The first step to creating the Node app in your command line terminal is:
$ mkdir statsigNodeApp && cd statsigNodeApp
$ npm init --yes
This will create a package.json file in the statsigNodeApp directory.
Next, let’s install statsig-node SDK.
$ npm install statsig-node
Now, we’re all set to write our main app’s logic. Here’s the code that checks the gate we just created every second and writes out whether it passes or not. Copy and paste this into a file named index.js.
https://medium.com/media/153cc5e35683db3d164c4e419232f32b/href
One last thing is you need to replace the ‘secret-API-KEY’ with your own API key, which you can find in your project’s settings:
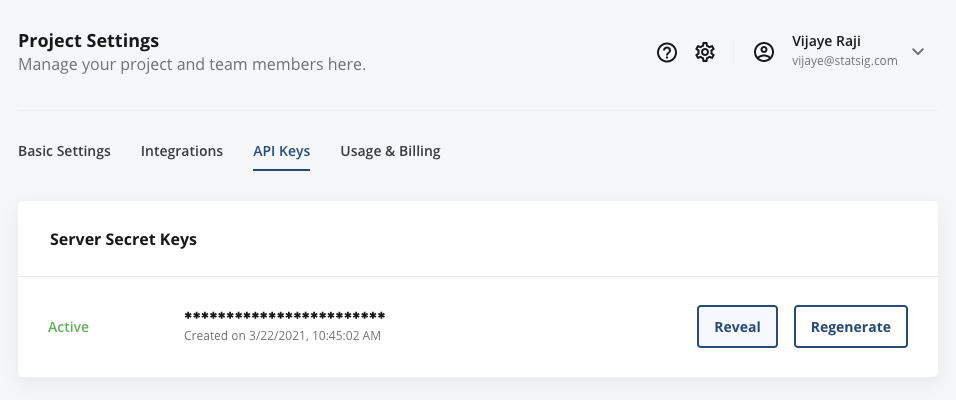
With that replaced, you are ready to run this app by issuing this command:
$ node index.js
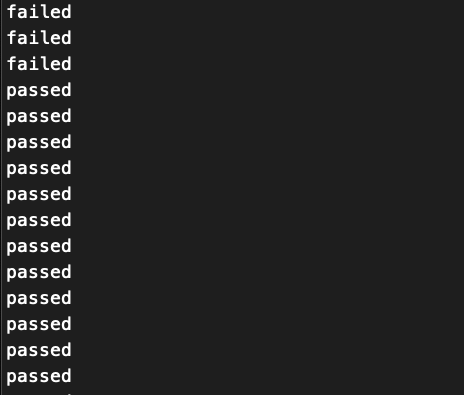
You will see something like this in the output:
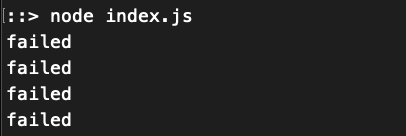
This means that the flag is evaluating to ‘false’ all the time. Let’s go ahead and create a new rule that turns on this feature for everyone.
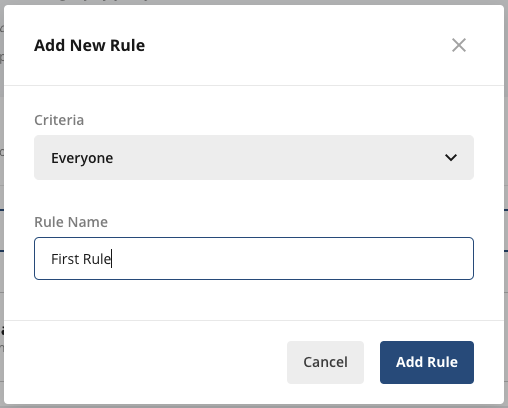
And let’s make sure to hit that ‘Save Changes’ button.

Now, if we had kept that Node App running, you’ll notice that it has started saying ‘passed’ automatically, since now this feature flag is turned on to everyone.
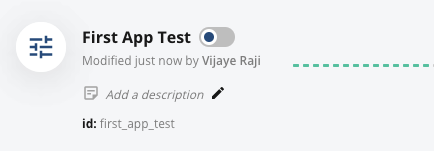
You can now try turning off this feature in the console.
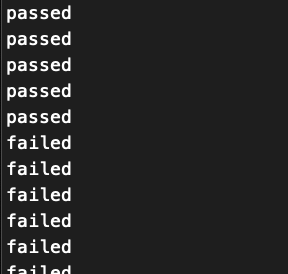
Which will immediately make the feature fail the check and the app will go from ‘passed’ to ‘failed’ to reflect the change.
And that’s it!
Hope this was helpful in getting you started and on your way to creating more complex features! As always we’re here to help out. You can join our Slack community here: https://statsig.com/community.
Build fast?
Recent Posts
Announcing the Statsig <> Vercel Native Integration
Introducing the Statsig <> Vercel Native integration - the first native feature flagging and experimentation integration on the Vercel marketplace. Read More ⇾
How to think about the relationship between correlation and causation
Learn to distinguish correlation from causation and avoid common pitfalls in data analysis. Master causal inference and spot misleading "aha moments." Read More ⇾
What are guardrail metrics in A/B tests?
Guardrail metrics in A/B testing prevent unintended negative impacts, ensuring holistic, informed, and responsible experimentation. Read More ⇾
Announcing Statsig Lite
Introducing Statsig Lite: the free, self-service tool powered by Statsig's trusted stats engine. Upload your experiment data and get reliable insights instantly. Read More ⇾
How Statsig uses query-level experiments to speed up Metrics Explorer
Experimenting with query-level optimizations at Statsig: How we reduced latency by testing temp tables vs. CTEs in Metrics Explorer. Read More ⇾
How Statsig’s data platform processes hundreds of petabytes daily
Find out how we scaled our data platform to handle hundreds of petabytes of data per day, and our specific solutions to the obstacles we've faced while scaling. Read More ⇾


